WattChop Platform Guide

Free energy analysis for all.
Perfect solar and battery sizing for those ready to save.

WattChop is a Tariff Smart platform for commercial solar + storage. Unlimited projects and energy fingerprints are free. The optimization that proves the right battery size costs $250 — and your first one is on the house.
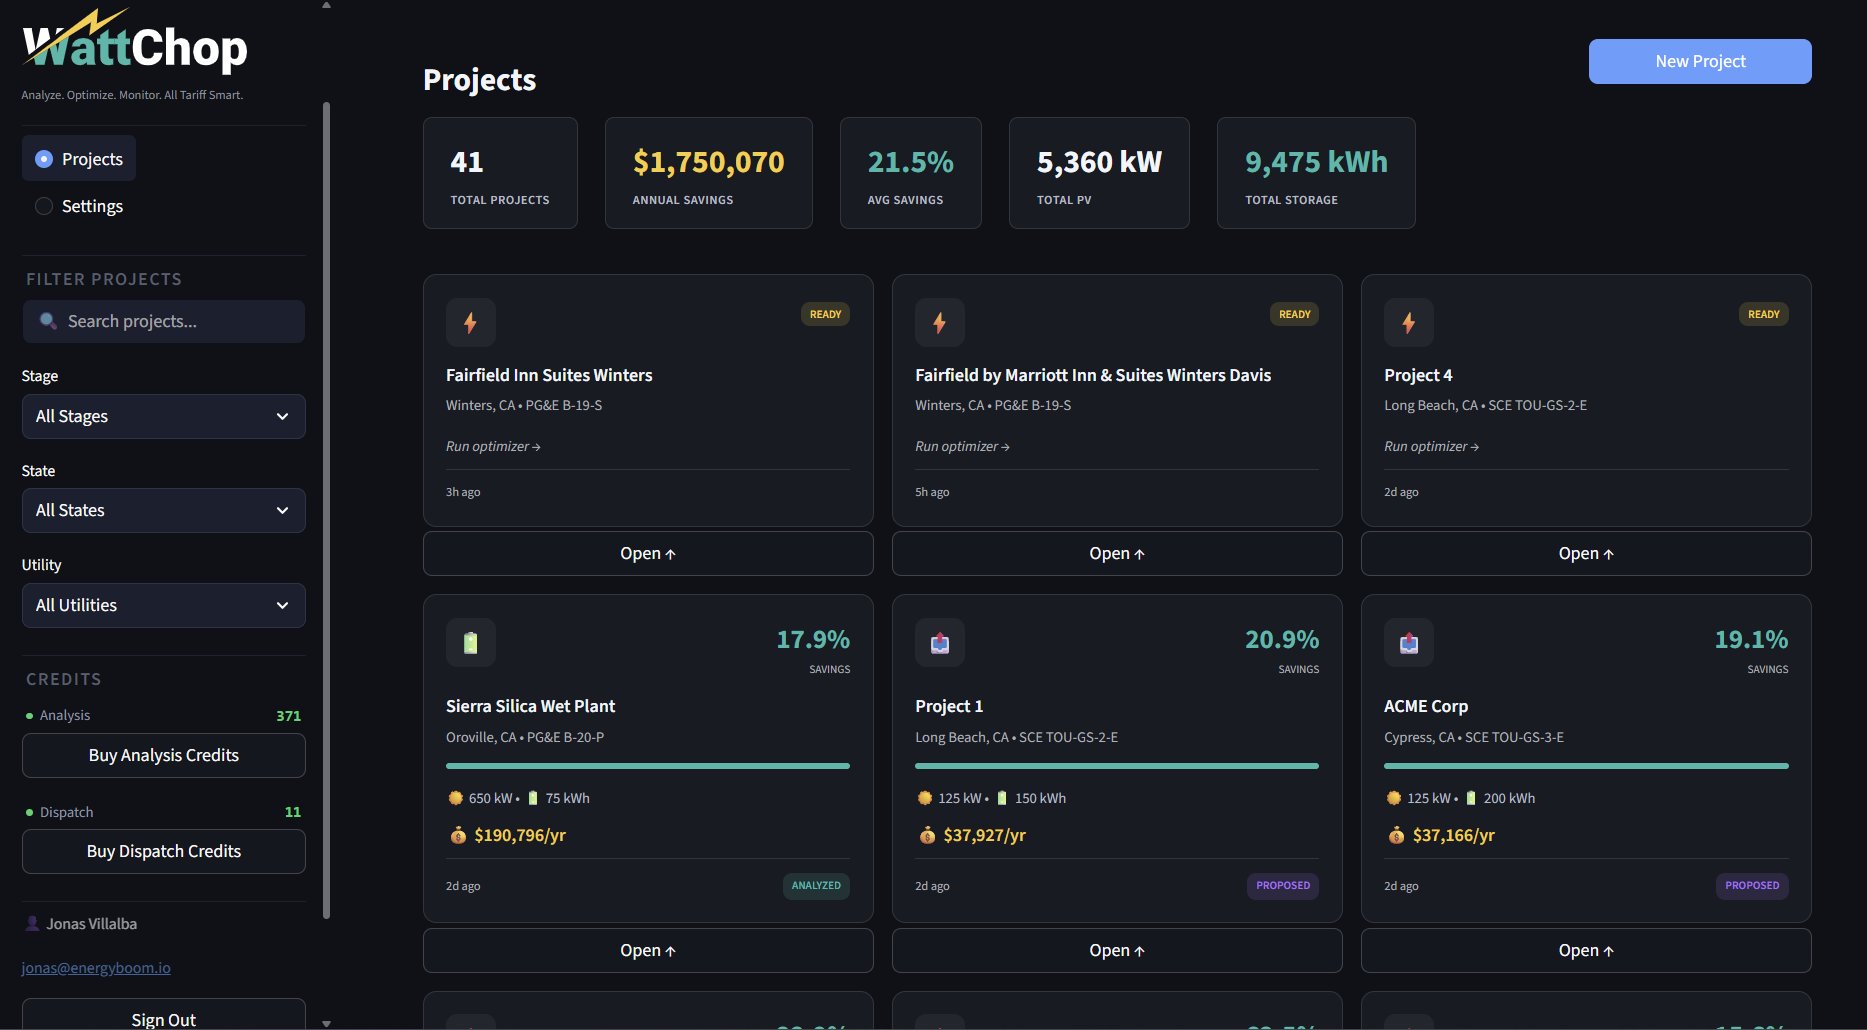
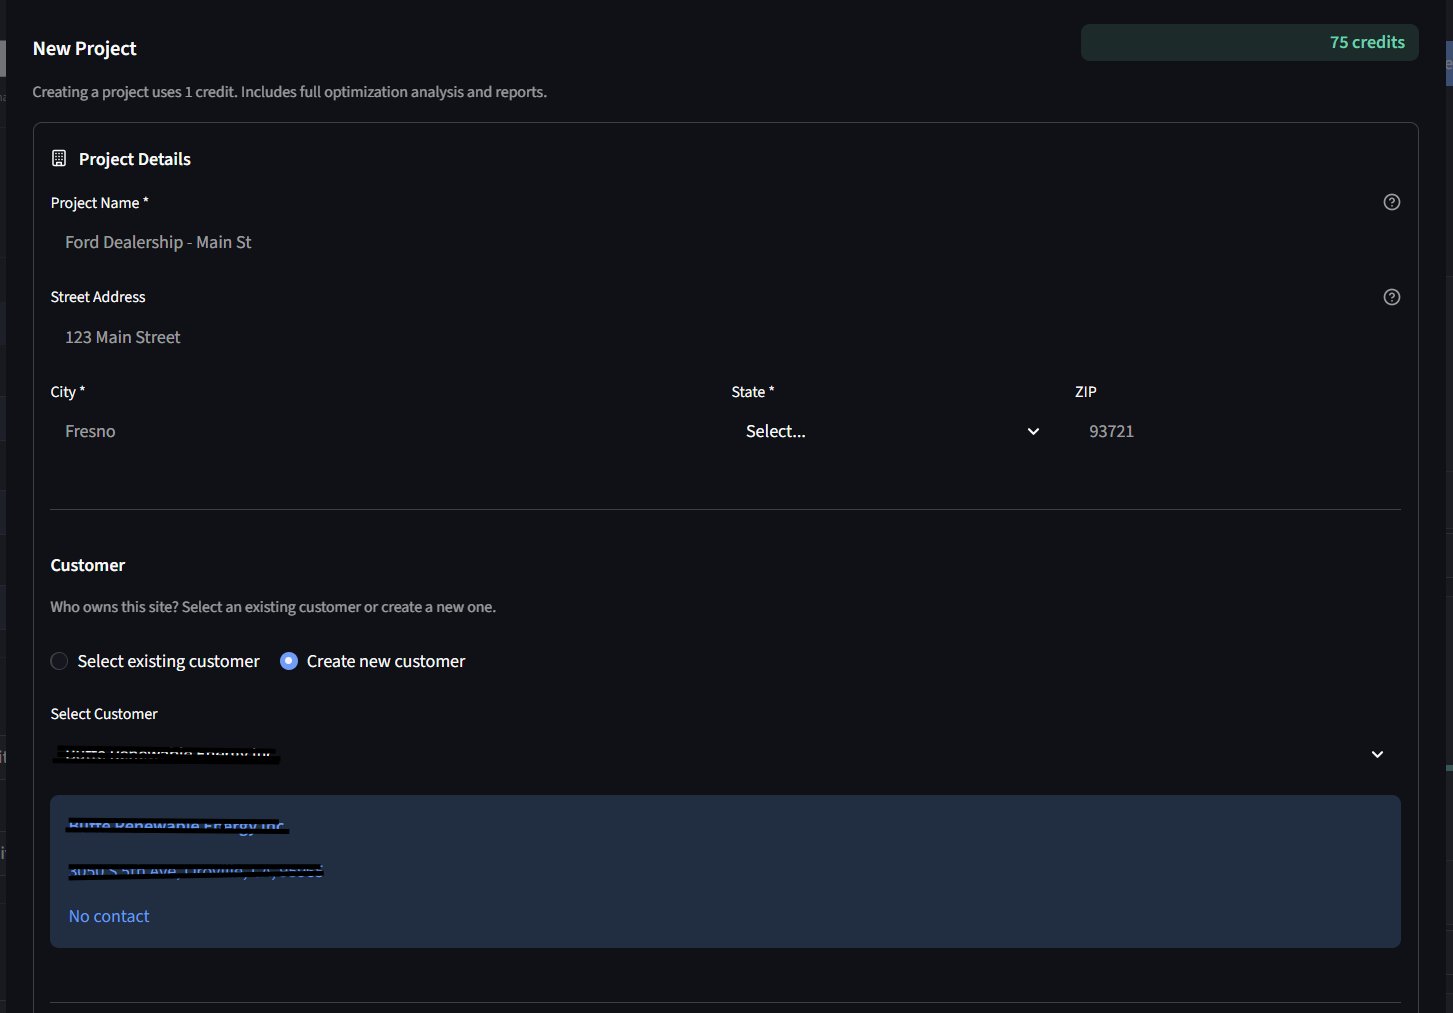
⚡ Analyze · Optimize · Monitor · All Tariff Smart
01

Create a project

1
Sign in or create an account
Go to app.wattchop.com. Sign in with your email and password, or click "Sign Up" to create a free account. Your first optimization credit is included automatically.
WattChop sign-in screen
Sign in to your account
2
Click "New Project"
From the projects dashboard, click the New Project button. Give the project a descriptive name (e.g. "Ford Dealership — Main St") and enter the site address. The address is required for weather correlation and PV modeling.
Projects dashboard with portfolio summary
Projects dashboard — your energy portfolio at a glance
New project creation form
New project — enter name, address, and customer
3
Select utility and tariff
Search by utility name or state. WattChop has 2,900+ utilities. Select the correct rate schedule (e.g. SCE TOU-GS-2-D, PG&E B-19-S). If you don't see your tariff, you can request a custom build for $100.
Tariff selection with utility and rate schedule
Select utility and tariff — complete each step to unlock the optimizer
02

Load your data

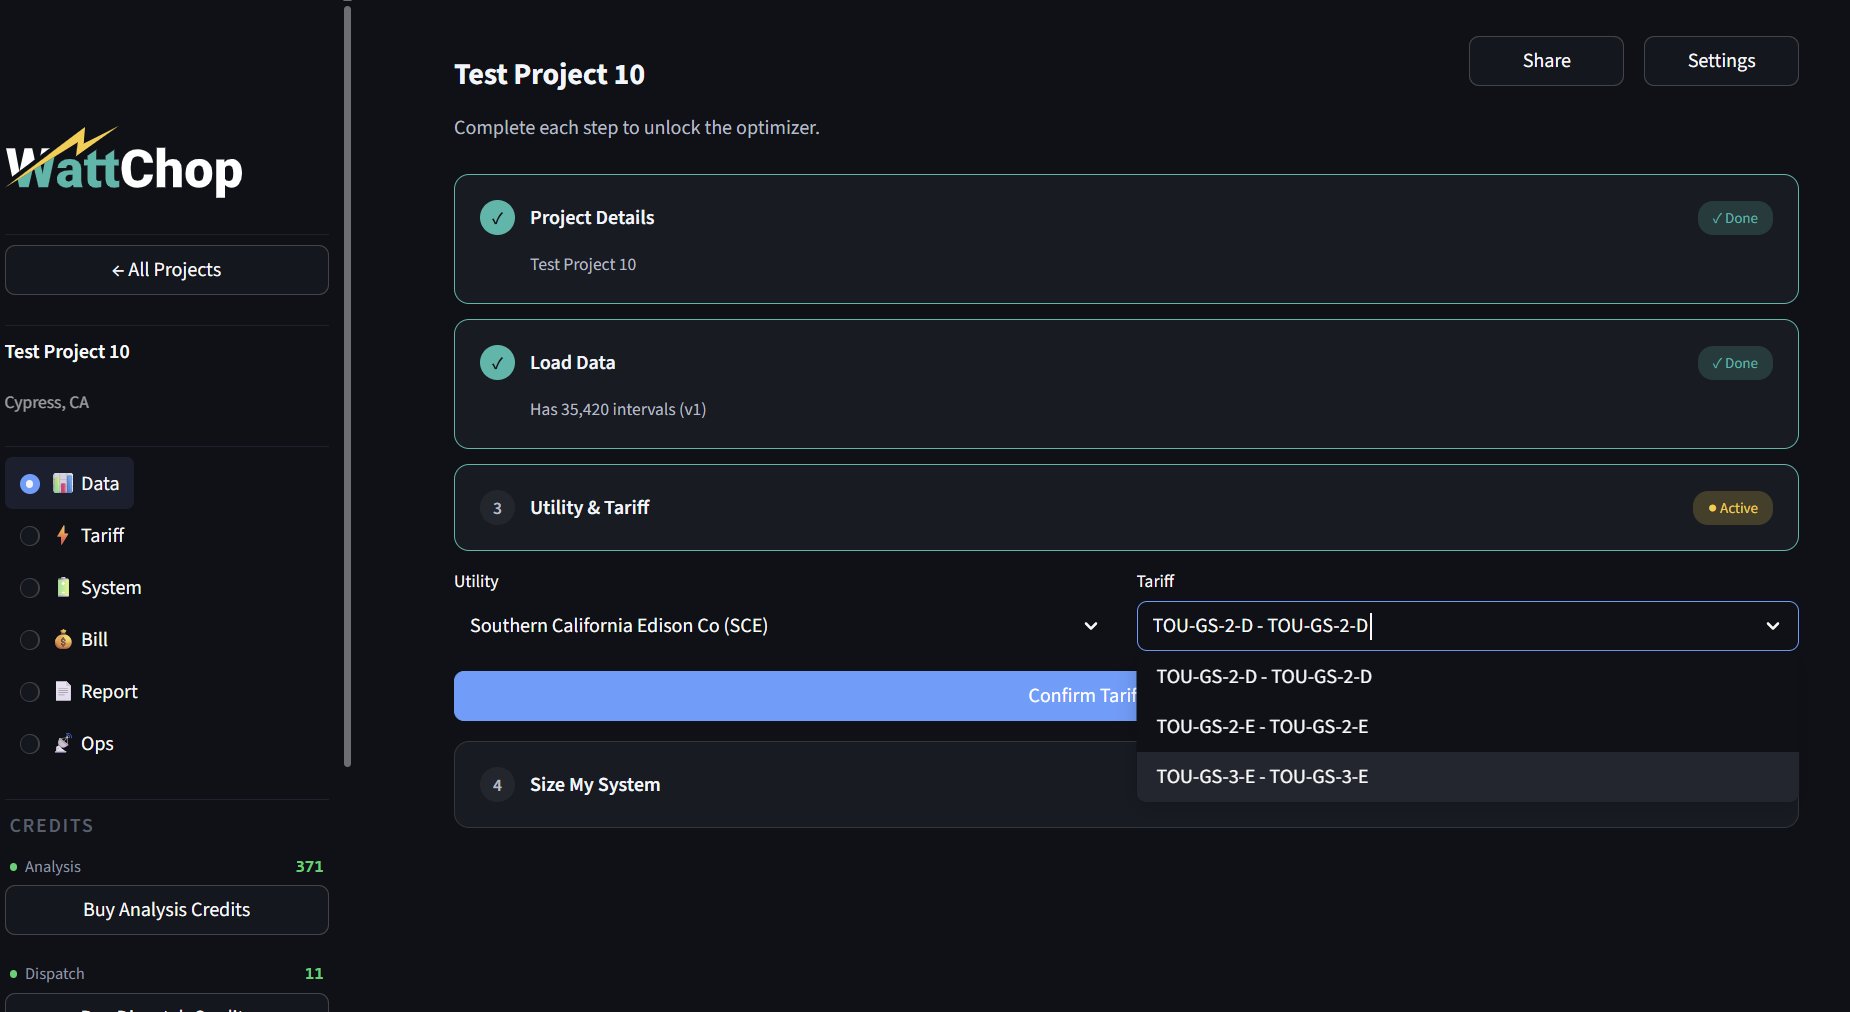
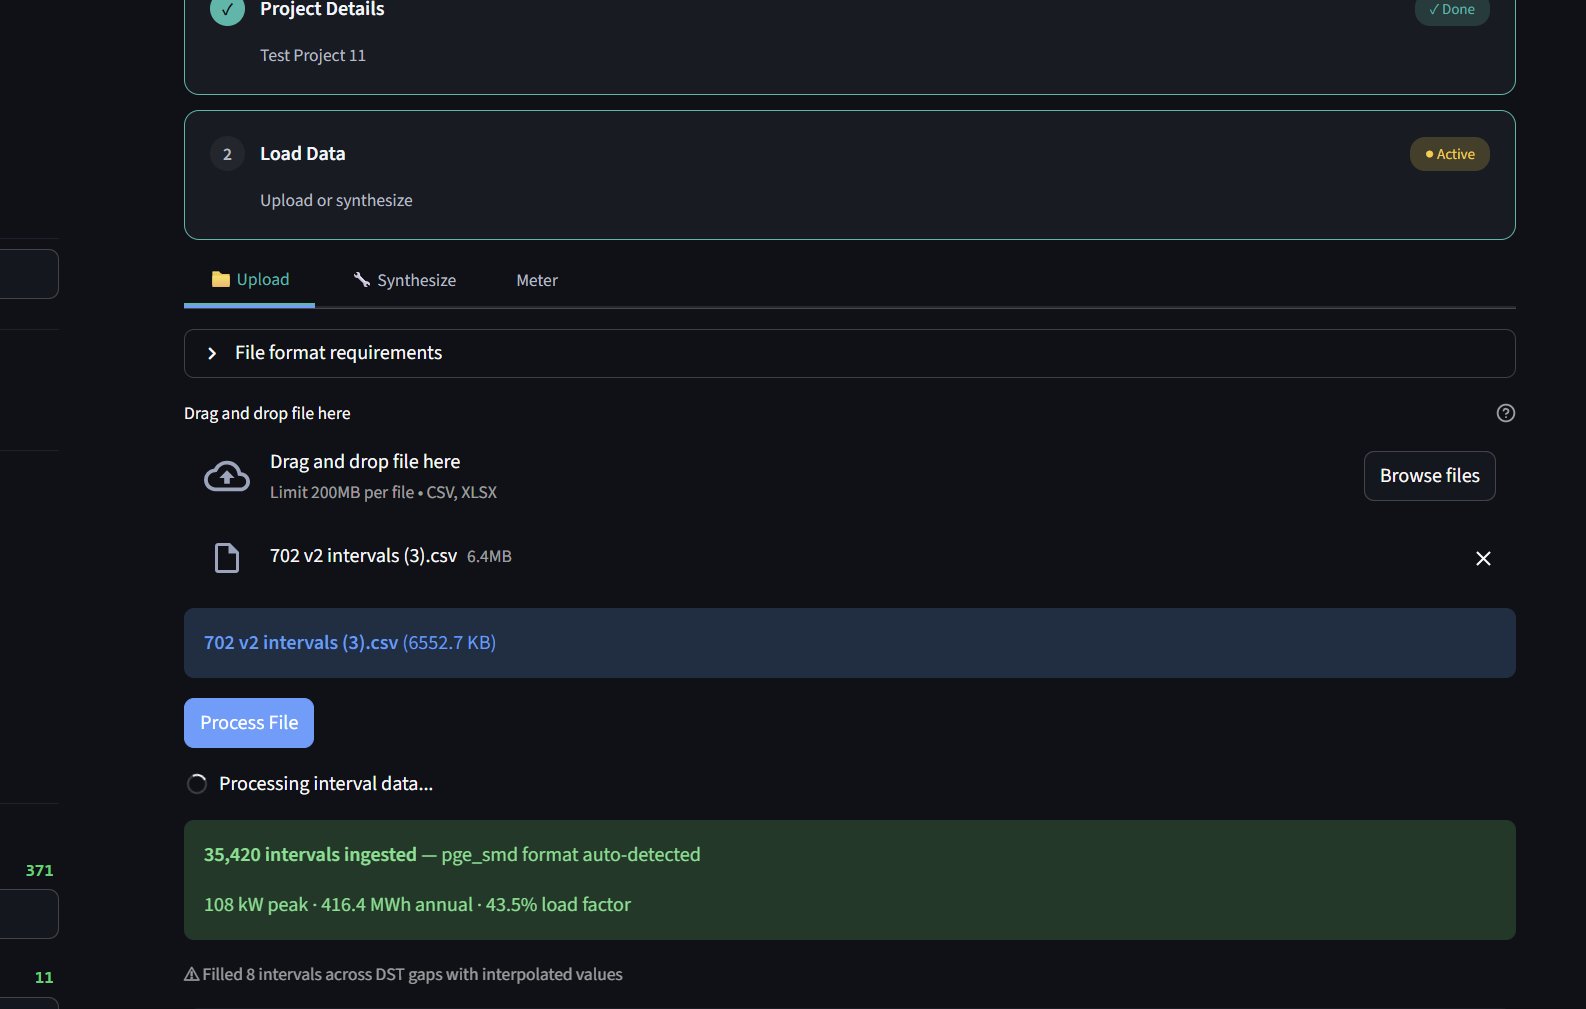
Navigate to the Data tab inside your project. You have two paths depending on what data you have.

A
Upload interval data (preferred)
Click "Upload" and drop your Green Button XML or CSV file. WattChop auto-detects format, interval resolution (15, 30, or 60 minutes), and handles DST gaps automatically. A full year of data gives the best results, but partial years work too.
💡 After upload, WattChop shows peak demand, annual kWh, and load factor immediately — no optimization credit needed.
Data upload with auto-detection and instant stats
Upload — auto-detects format, shows instant stats
B
No smart meter? Use the Synthesizer
If your customer only has monthly utility bills, the WattChop Synthesizer generates a realistic load profile. Enter monthly kWh, select a building type, and optionally add peak demand targets for tighter accuracy. The more detail you provide, the sharper the picture.
Synthesizer input form with monthly kWh
Synthesizer — build a load profile from monthly bills
03

Read the Energy Fingerprint

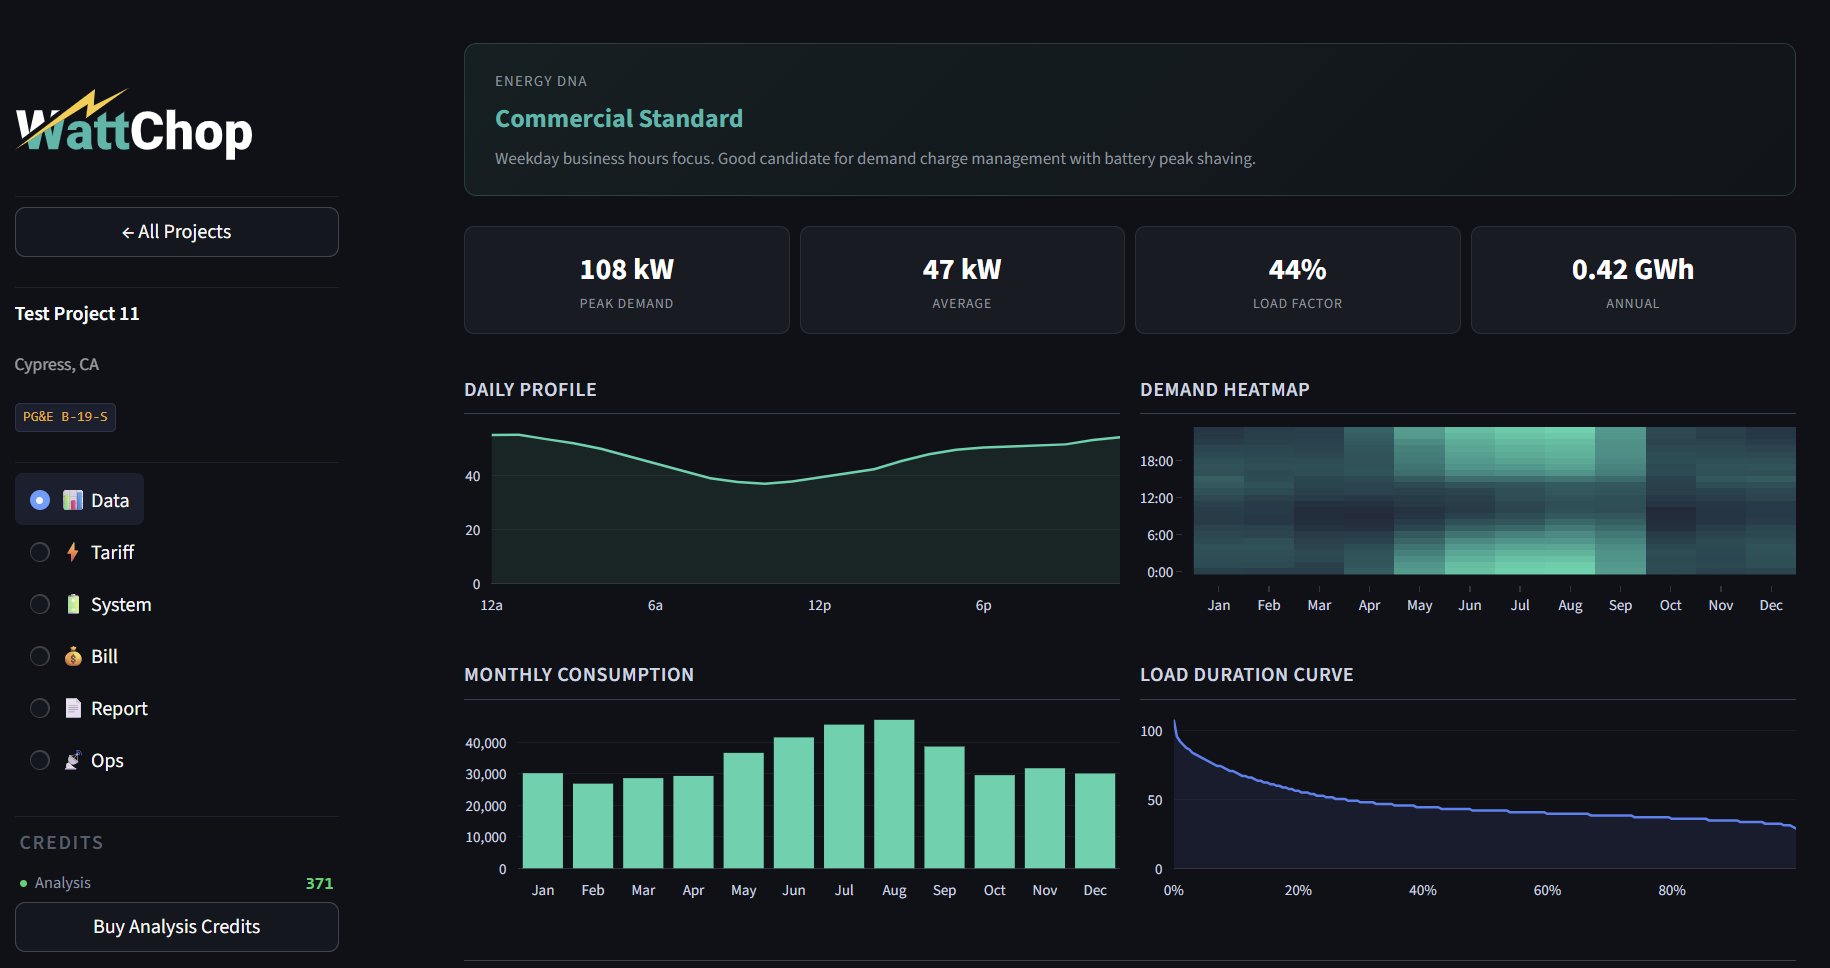
Once data is loaded, the Data tab shows your Energy Fingerprint — a full picture of how this building uses electricity, with daily profiles, heatmaps, and seasonal patterns.

1
Review key metrics
Peak demand (kW), average load (kW), load factor (%), and annual consumption. The daily profile and demand heatmap show when this building draws the most power — spikier loads benefit more from demand charge reduction.
Energy Fingerprint with daily profile and demand heatmap
Energy Fingerprint — daily profile, heatmap, monthly consumption, load duration
2
Check the tariff rate structure
Switch to the Tariff tab to see the full rate breakdown: energy charges by TOU period, demand charges by season, non-bypassable charges, and fixed charges. Sites with high demand charges are prime battery candidates.
Tariff tab showing rate structure
Tariff — energy rates, demand charges, NBCs, and fixed charges
🎁 Everything above is free. You haven't used your credit yet. This level of insight alone is something every competitor charges for.
04

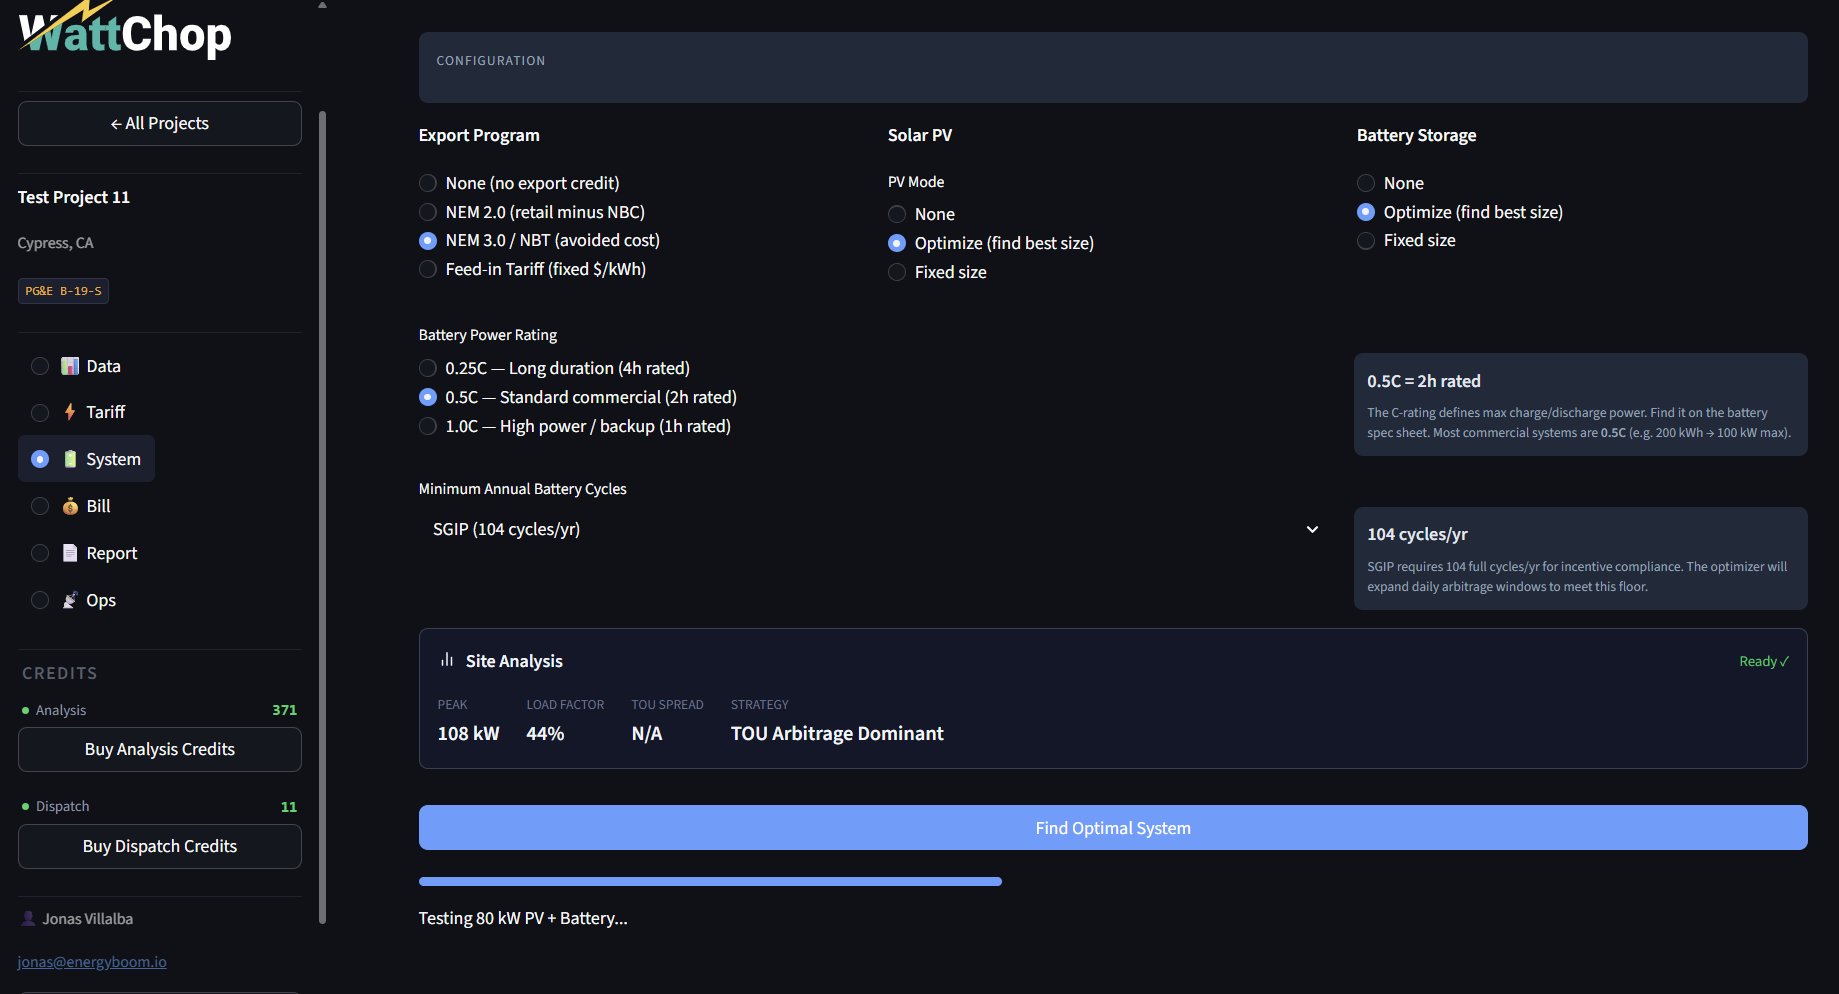
Run your first optimization

The optimizer runs a full dispatch simulation across all 35,000+ intervals. This typically takes 45–90 seconds. Do not navigate away while it runs — the progress bar will update as it tests candidate system sizes.
1
Configure and click "Find Optimal System"
On the System tab, set your export program (NEM 2.0, NEM 3.0, or none), choose whether to include solar PV, select battery C-rate, and set cycle requirements. Click "Find Optimal System" to run the Choptimizer — a two-stage analysis using fast pre-sizing followed by targeted dispatch simulations.
System tab configuration and optimizer
System tab — configure export program, PV, battery, then optimize
2
Review the recommendation
WattChop returns the recommended PV capacity, battery kW/kWh, annual savings, and bill reduction percentage. The savings breakdown shows exactly how much comes from solar offset, demand shaving, and energy arbitrage — the chart that proves why bigger isn't always better.
Optimization results with savings breakdown
The Reveal — optimal system size with savings breakdown
3
Explore the financial analysis
The Bill tab shows the full financial picture: net system cost after ITC and depreciation, simple payback, IRR, 25-year NPV, capital stack, and cumulative cashflow projection. WattChop automatically separates solar ITC (30%) and battery ITC (40%) for FEOC compliance.
Bill tab financial analysis with capital stack
Bill — net cost, payback, IRR, capital stack with split ITC
Cashflow projection and cost breakdown charts
25-year cashflow projection with payback crossover
💡 After your first analysis, you can adjust the battery size manually and re-run at no extra cost. Try different sizes to show clients the tradeoff curve.
05

Explore the project tabs

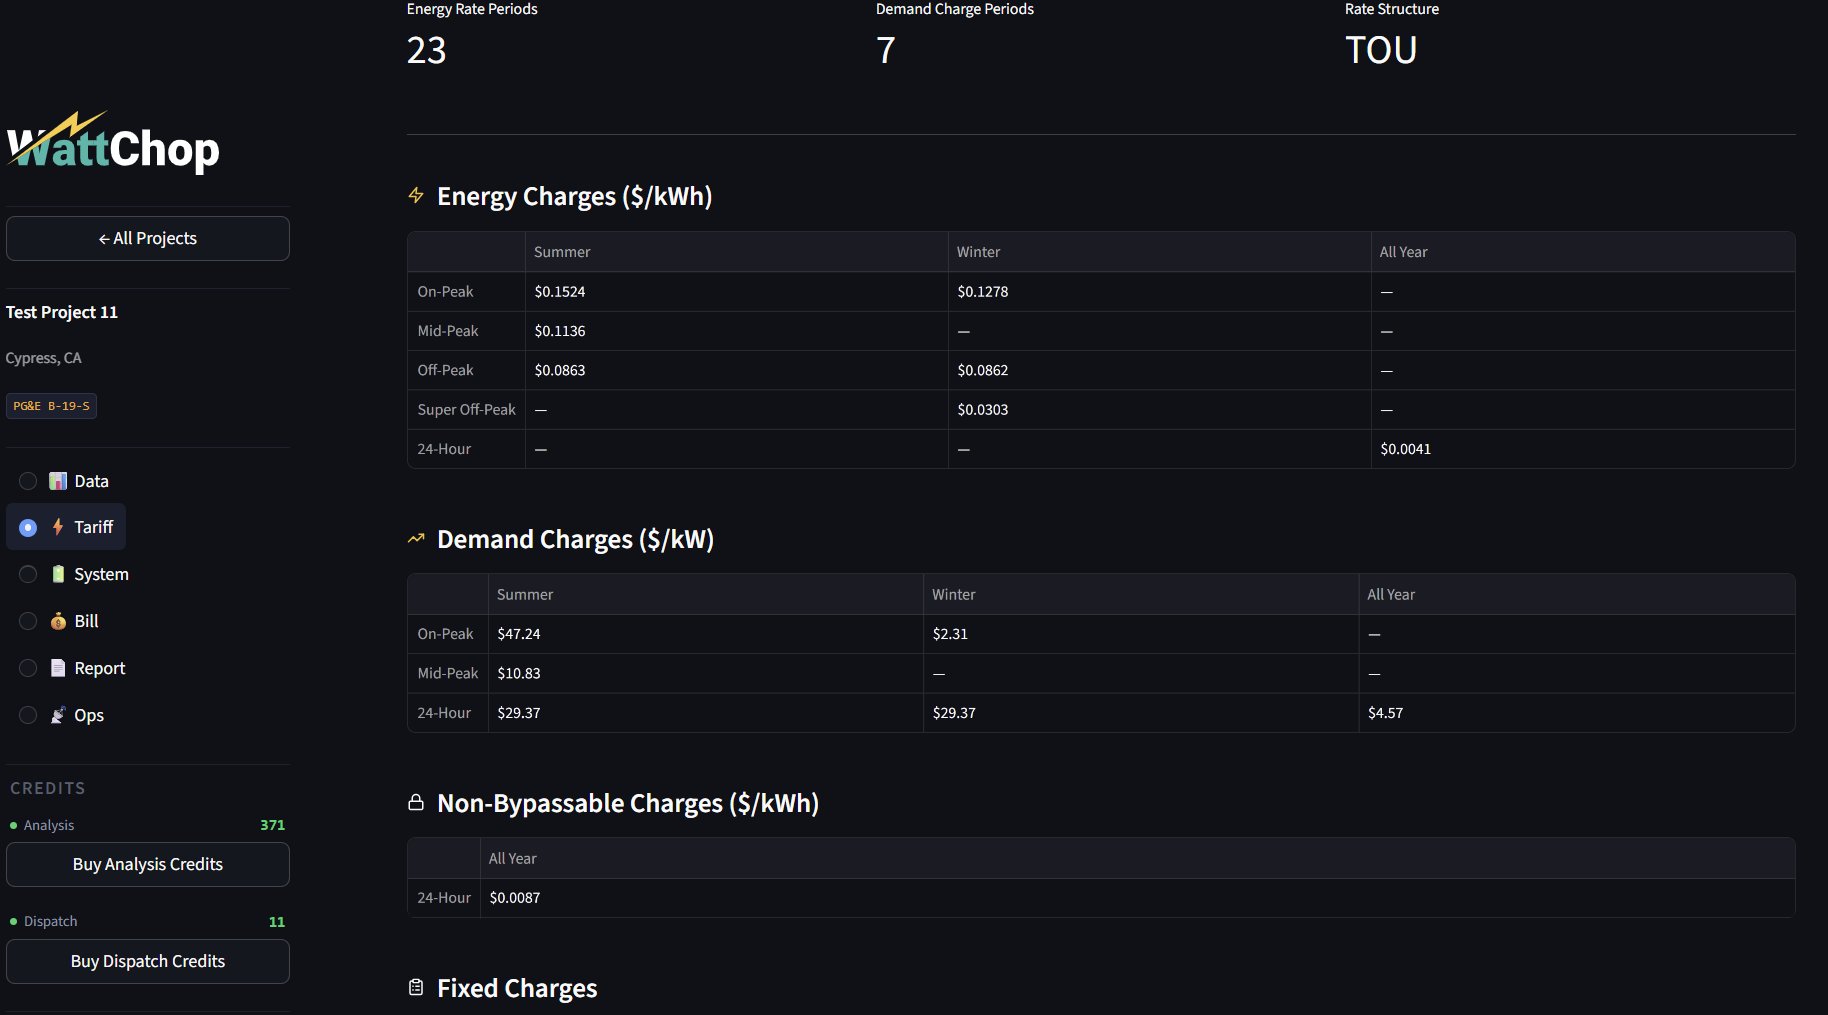
Every project has six tabs. Here's a quick reference:

Data Tariff System Bill Report Ops
Data Upload or synthesize interval data. View energy fingerprint: daily profile, demand heatmap, monthly consumption, load duration curve.
Tariff Utility rate structure — energy TOU rates, demand charges, NBCs, fixed charges. Set export program (NEM 2.0, NEM 3.0, FIT).
System Optimizer configuration and results. Run PV + battery sizing, view dispatch preview, savings breakdown, diminishing returns curve.
Bill Full financial analysis. Net system cost, payback, IRR, NPV, capital stack, cashflow projection. Split ITC for FEOC compliance.
Report Export audit-grade PDF proposals. Download cost spine CSV and monthly bill data.
Ops Live performance monitoring for commissioned projects. Actual savings vs predictions. Coming soon for most projects.

Beta Notes

WattChop is in active beta. A few things to be aware of:

Optimizer run time: 45–90 seconds
The Choptimizer runs real dispatch simulations across every 15-minute interval in your dataset — that's 35,000+ data points per candidate system size. This takes 45–90 seconds depending on the site complexity. Stay on the page while it runs; the progress bar updates as each candidate is tested.
Avoid hard refresh (Ctrl+Shift+R)
A hard browser refresh clears your session and redirects to the sign-in page. This is expected behavior — just sign in again and your project data will be exactly where you left it. Use normal page navigation (clicking tabs, back button) instead of hard refresh.
$

Free vs paid

Free tier
$0 always
✓ Unlimited projects
✓ Interval upload (CSV, Green Button, IOU formats)
✓ WattChop Synthesizer
✓ Energy Fingerprint
✓ 2,900+ utility tariffs
✓ Weather correlation
✓ 1 free optimization credit
Optimization
$250 /analysis
✓ Joint PV + battery recommendation
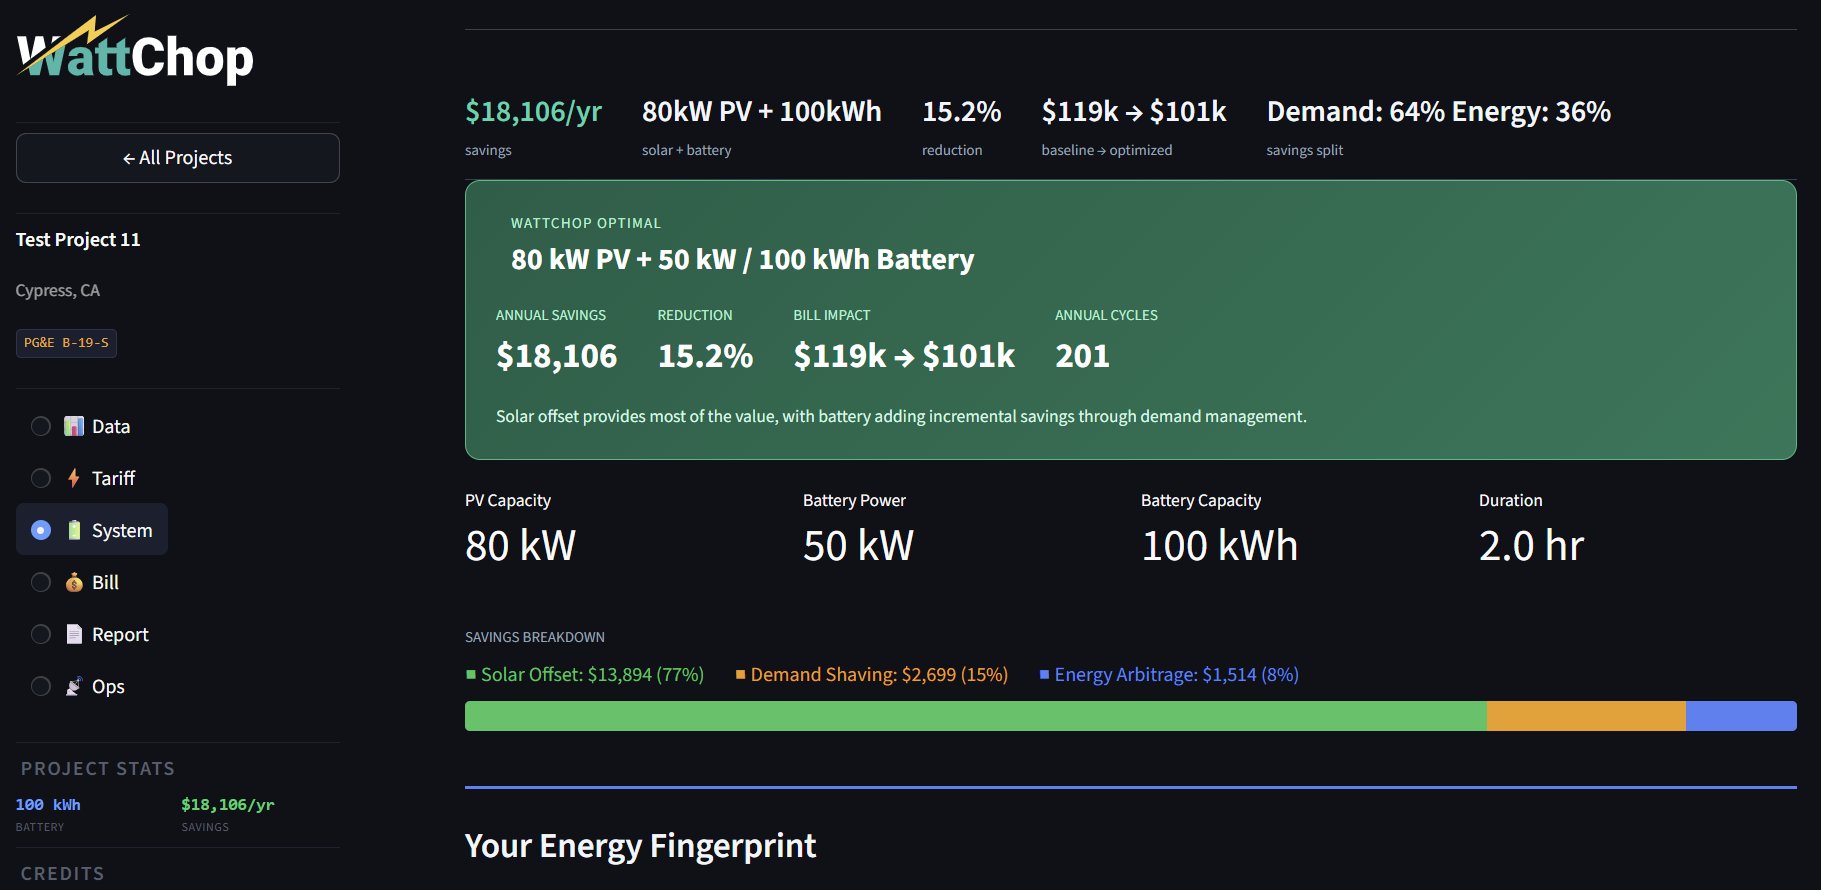
✓ Diminishing returns curve
✓ Monthly savings breakdown
✓ Demand vs arbitrage vs solar split
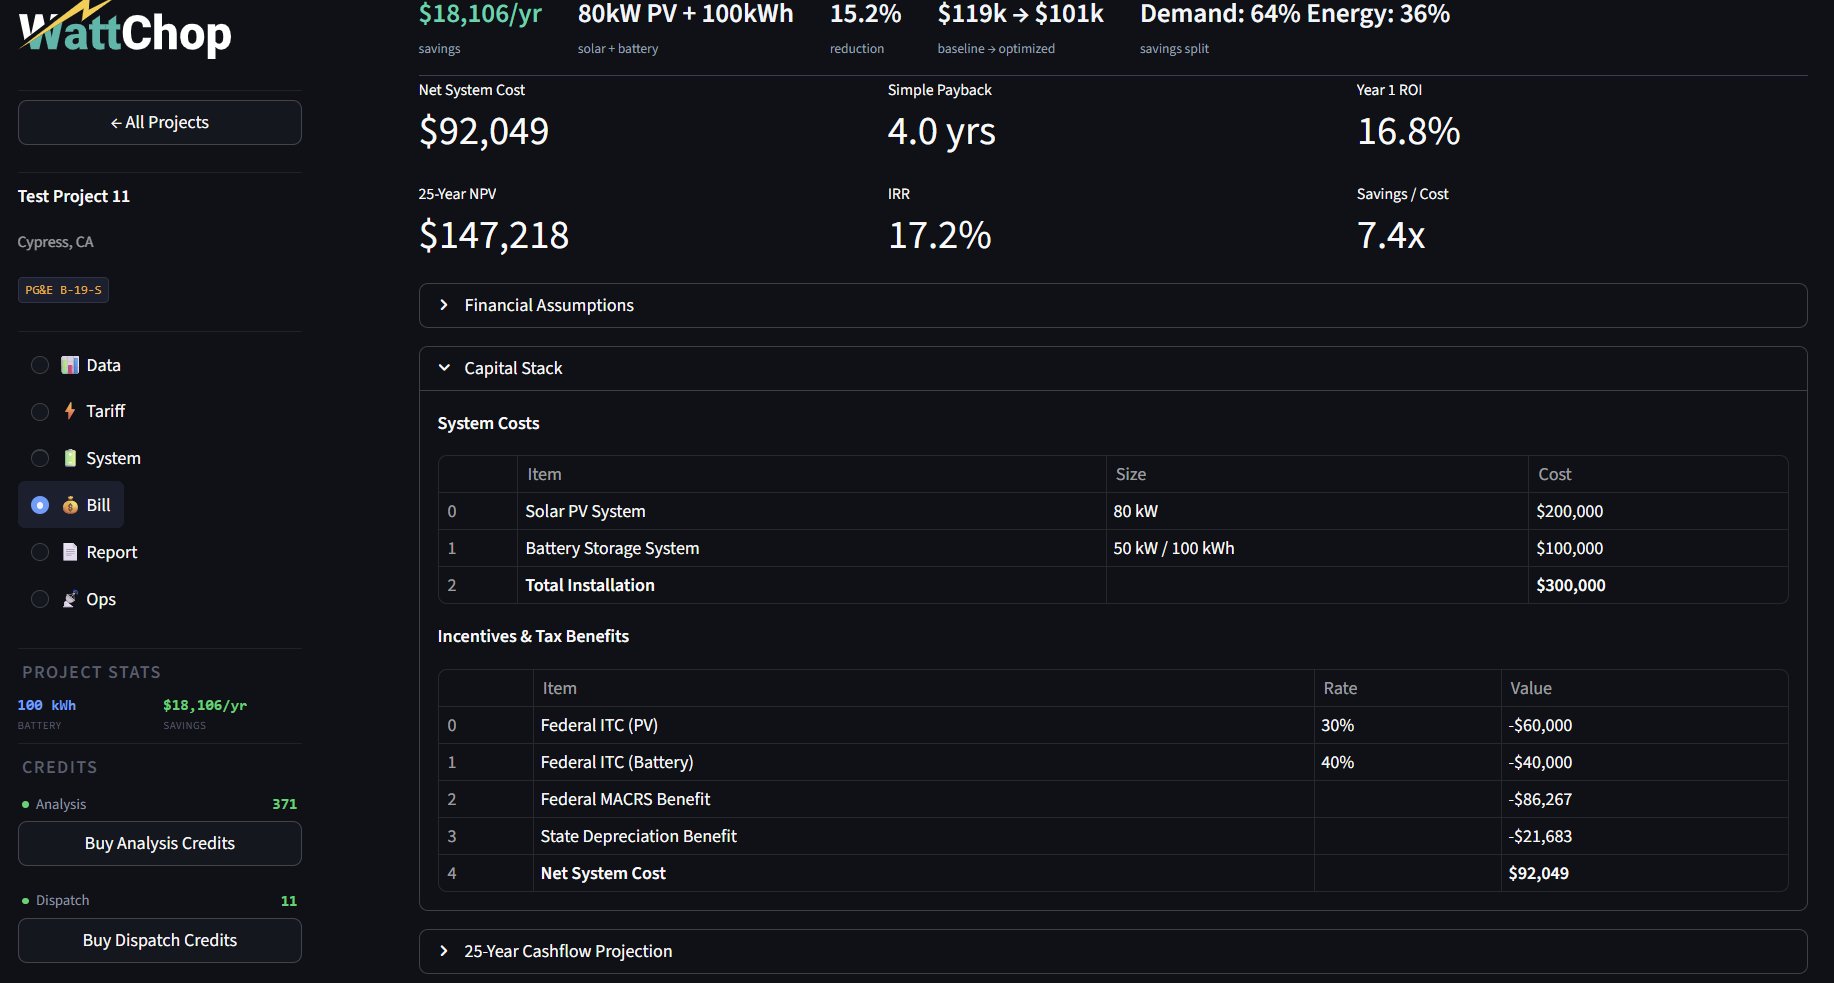
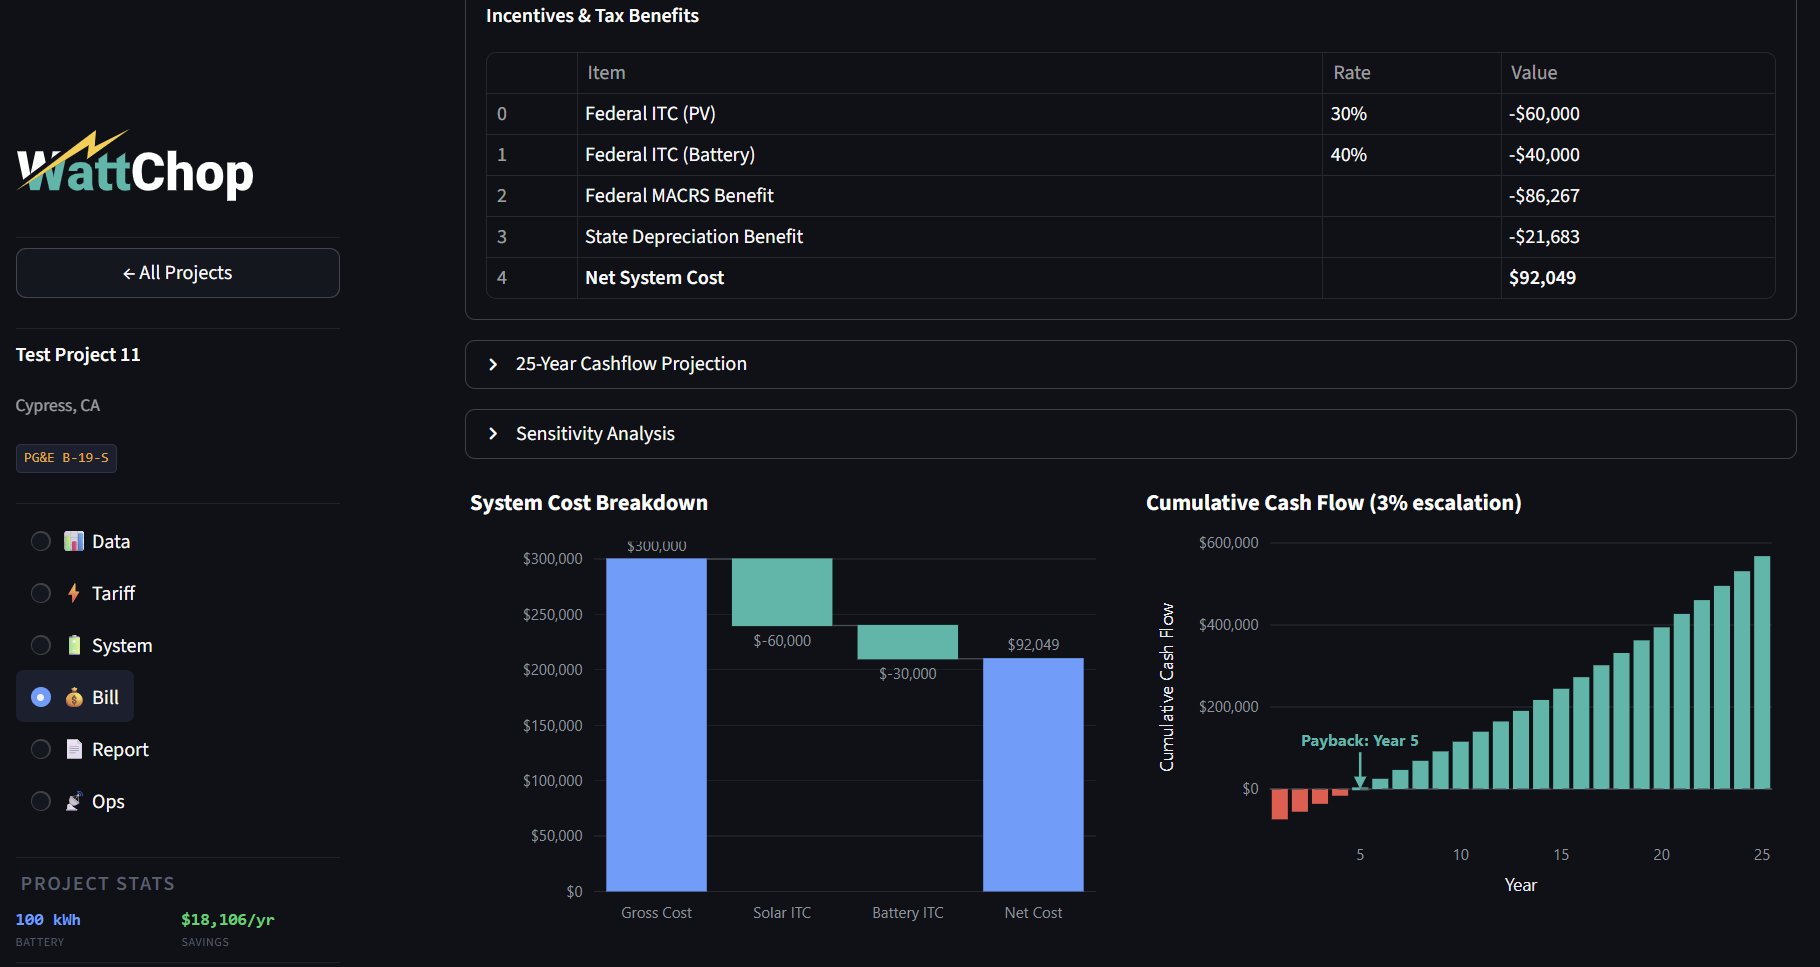
✓ Full financial analysis + cashflow
✓ Audit-grade PDF proposal
✓ Unlimited re-evaluation after
$50
Dispatch schedule / run
$1,200
Live dashboard / year
$100
Custom tariff build
?

Frequently Asked Questions

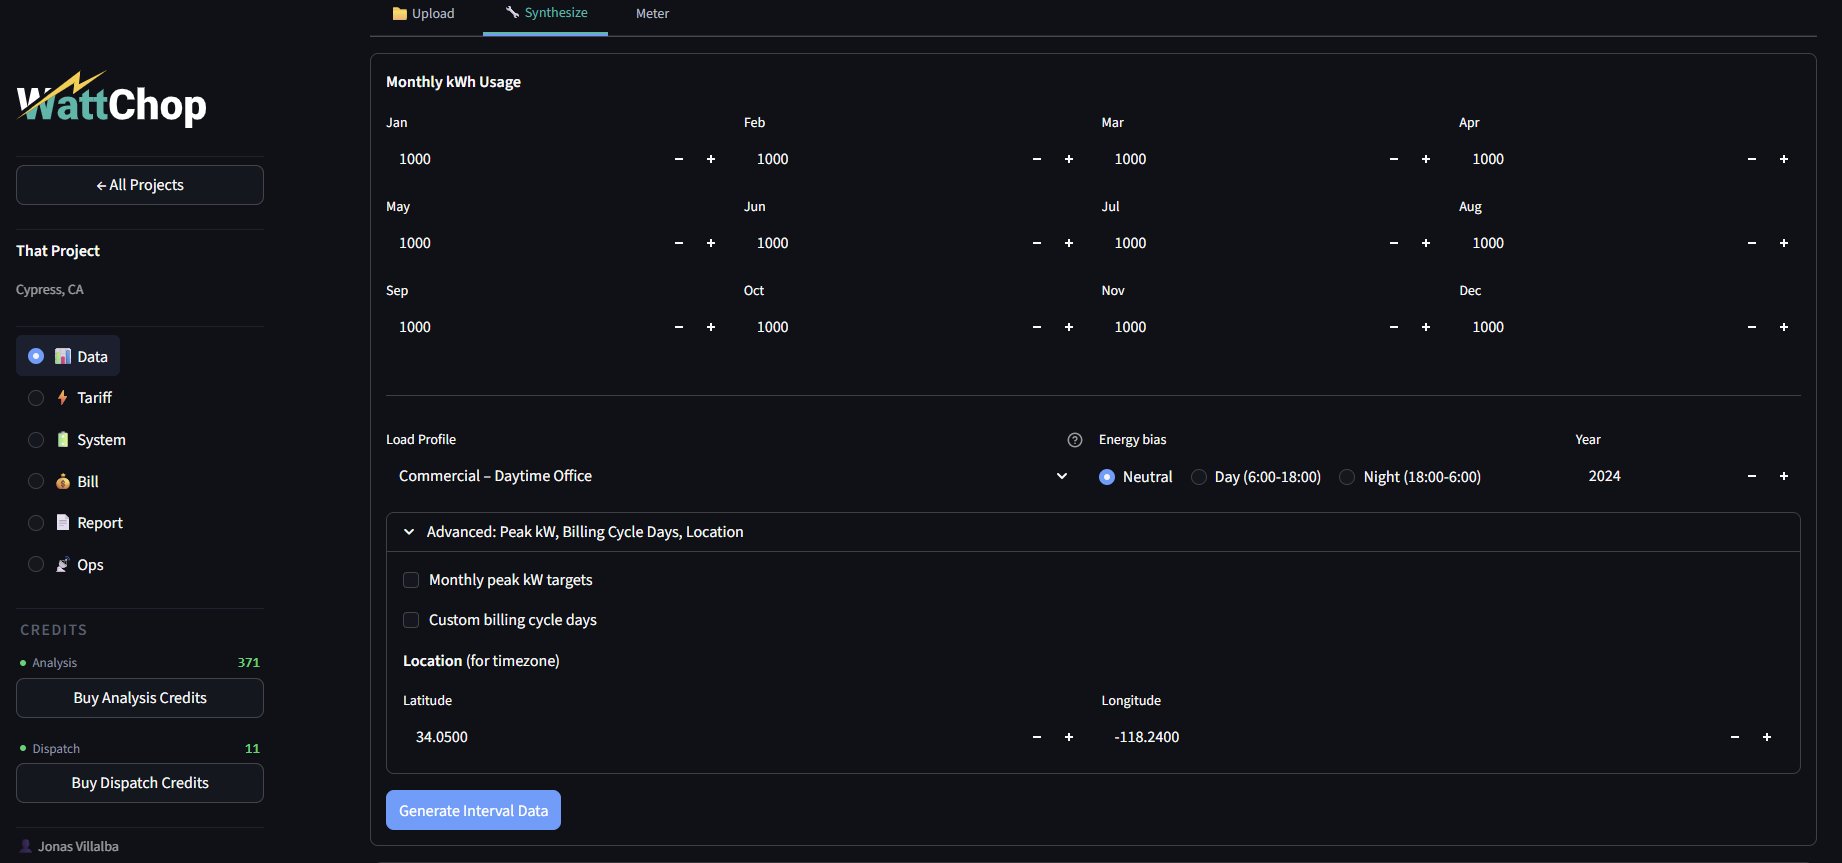
You have two paths. If your customer has a smart meter, download a Green Button XML or CSV export from their utility portal — a full year of 15-minute interval data is ideal, but 6 months works. WattChop auto-detects PG&E, SCE, and SDG&E export formats. If they only have paper or PDF bills, use the WattChop Synthesizer: enter monthly kWh usage, select a building type, and WattChop builds a realistic load profile. The synthesizer is free and works for any commercial site.

WattChop has 2,900+ utilities but not every rate schedule for every utility. If your tariff is missing, you can request a Custom Tariff build for $100 — turnaround is 2 business days and it's permanently added to the platform for all users.

Probably yes — WattChop's core thesis is that bigger isn't always better. Check the diminishing returns curve on the System tab: if the savings flatten early, the site genuinely doesn't benefit from more capacity, usually because demand charges are low or the load profile is flat. You can always adjust the battery size manually and re-evaluate at no extra cost to explore the tradeoff.

Yes. Upload the customer's utility interval data — if solar is already running, the intervals reflect net load after solar production. WattChop will optimize the battery against that net load. For a more precise analysis that decomposes pre-solar usage and models PV degradation from the install date, that dedicated UI is on the near-term roadmap. Contact us if this is urgent for a specific project.

Multi-meter VNEM is supported in the data model and project settings. The full visualization and VNEM-specific reporting UI is still being built out. If you have a live VNEM project, reach out directly — it's a priority use case and we want real data to validate against.

Each project's first optimization uses one credit ($250, first one free). After that, re-running with different battery sizes, changing PV options, or adjusting inputs costs nothing. Credits only gate the initial analysis per project — unlimited re-evaluation is included. Volume discounts are available for high-volume EPCs.

WattChop accepts Green Button XML, CSV files, and IOU-specific exports (PG&E SMD, SCE, SDG&E formats are auto-detected). The platform handles 15-minute, 30-minute, and 60-minute intervals, automatically fills DST gaps, and flags data quality issues. If your file isn't parsing correctly, check that it has a timestamp column and a kWh or kW column.

Yes. WattChop automatically separates the Federal ITC for solar (30%) and battery storage (40%) in the financial analysis. This split calculation is required for FEOC compliance and is a significant advantage over platforms that use blended ITC rates. The capital stack on the Bill tab shows each incentive line item individually.

WattChop is built for commercial and industrial (C&I) solar + storage. Residential accounts can sign up and use the free tier, but the $250 optimization price is designed for commercial deal sizes. A residential tier may come in 2027 — for now the platform isn't optimized for residential workflows.